Visualization
Visualization
The DMFB Static Simulator was designed with visualization in mind. The objectives of our visualization system are twofold:
♦ To provide the highest quality debugging assistance to aid the development and integration of algorithms within the framework; and
♦ To provide high quality images and videos that can be integrated into peer-reviewed publications, presentations, etc.
The visualization suite was written in Java. The interface files created by each stage of the framework can be viewed using the visualization suite. It is optional and bypassable, allowing the compiler to execute as one atomic program, passing all internal data structure between stages and suppressing file I/O; this reduces runtime and file system clutter.
DAG Visualization
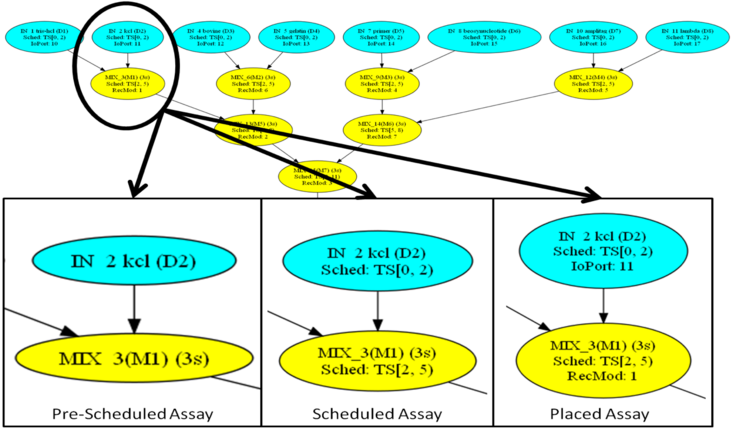
The input to the synthesis framework is a DAG specification of an assay. We convert the DAG to the .dot file format, which can be displayed using GraphViz. Each vertex (operation) in the DAG is annotated with information, including its operation type (e.g., dispense, mix, etc.), its latency, and its name (if known). The Scheduler determines the start and finish time for each operation in the DAG, and updates the .dot file; it also inserts storage operations when a droplet is produced by an operation, but is not consumed immediately. The Placer determines the location on the DMFB surface where each assay operation is performed within the (start, stop) interval computed by the scheduler, and updates the .dot file accordingly.
2D Placement Visualization
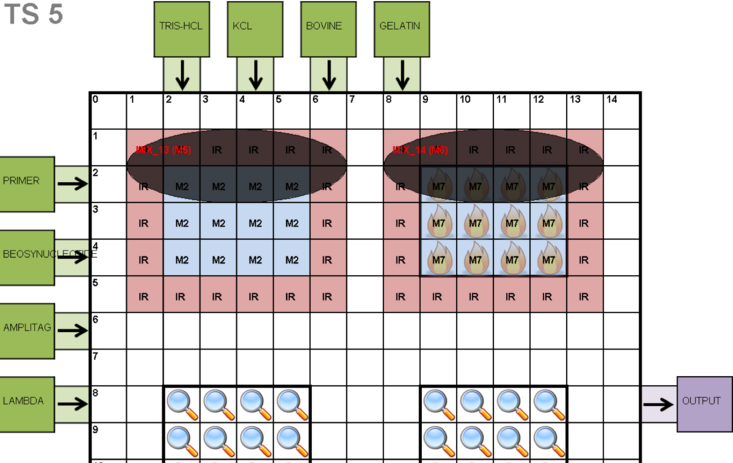
The 2D placement visualization generates an image for each time-step of the schedule. Light blue cells depict concurrent mixing operations, while dark ovals provide information about the mixing operations with respect to their DAG nodes. Light red cells depict the interference region (IR) of the mixing operations; any wayward droplet routed into the interference region will inadvertently interfere with the mixing operation, resulting in contamination. I/O reservoirs are depicted on the DMFB periphery: each input reservoirs is labeled with the type of fluid it contains; output reservoirs are simply labeled "output." Cells with insignias—fire and magnifying glasses—indicate that external devices that perform heating and detection are available at those locations. The heater is essentially a physical element that is placed above or below the chip. The detector, for example, could be an infrared camera, completely external to the chip, but focused directly on those specific cells.
3D Placement Visualization
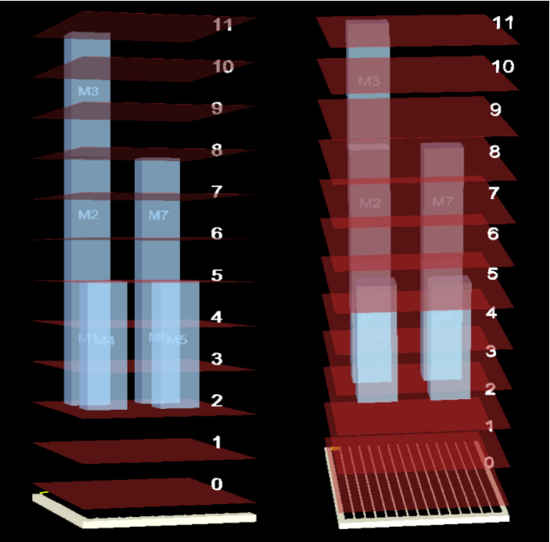
In a 3D placement, the third dimension (vertical axis) is time; this allows the user to view the scheduled and placed assay operations as each time-step of the schedule. A red plane above the DMFB is drawn for each time-step. Operations that have been placed on the DMFB stretch vertically above the cells that execute them. Modules are labeled with a module number, which can be used to find the corresponding assay operation in the DAG. The placement rotates so that it can be viewed from all angles; the user can also “fly” through the 3- dimensional space using keyboard controls to view the placement from any desired perspective.
Cyclic Route Visualization
The cyclic-route visualizer produces an image for each actuation cycle in which droplets are in motion. Droplets are numbered and the light red cells surrounding each droplet represent its interference region (IR). Similar to modules, two droplets will inadvertently mix if one enters another's IR. Each droplet's colors indicates that it is free to move forward along its route (green), that it is waiting for another droplet to move out of its way (yellow), or that it has reached its destination and has stopped (red). Other colors indicate droplet merging or I/O operations.
The cyclic route visualizer adds images for the cycles between routing phases where assay operations occur; for example, it shows droplets being mixed inside modules, as shown below.
The tool draws an image for each actuation cycle of each “routing phase” (the droplet routes computed for each timestep in the schedule). For each routing phase, the frames can be compacted into a movie, where each frame equals 10ms, creating a real-time video for a 100Hz DMFB.
Compact Route Visualization
The compact route visualizer draws a single image for each droplet route. Electrodes are numbered so that the user can see the exact path the droplet is taking. Although multiple droplets may be routed concurrently, only a single droplet's path is drawn in any image.
Wash Droplet Visualization
The visualizer can optionally track cell contamination and decontamination via washing. Dirty electrodes are filled with a brown color and labeled with the ID of the droplet that contaminated them. Wash droplets (blue; labeled with a ‘W’) clean contaminated cells, removing the brown shading, and have special I/O ports, also blue with a small image of a broom to represent “cleaning.”
Contact
Please direct any questions, comments, or other inquiries to the following e-mail address: microfluidics@cs.ucr.edu
Acknowledgment
This material is based upon work supported by the National Science Foundation under Grant Numbers 1035603, 1536026, and 1545097. Any opinions, findings, and conclusions or recommendations expressed in this material are those of the author(s) and do not necessarily reflect the views of the National Science Foundation.


